AI that turns raw data into actionable insights.
Your AI reporting agent aggregates data across tools, identifies patterns, and generates insights that drive better decisions - automatically.
Trusted by teams at
Your AI reporting agent aggregates data across tools, identifies patterns, and generates insights that drive better decisions - automatically.
Trusted by teams at
From raw data to actionable insights - four stages of intelligent reporting.
Connects to all your data sources - CRM, analytics, databases, spreadsheets - and handles ingestion, cleaning, and modeling. Single source of truth, no manual ETL.
Book a consultationData pipeline
PostgreSQL
Salesforce
Google Analytics
Google Sheets
Unified Dataset
4 sources · 12 tables · Clean
Doesn't just show metrics - analyzes trends, identifies anomalies, and highlights insights worth your attention. Learns what KPIs matter to your business.
Book a consultationTrend analysis
Monthly Active Users
↑ 24% YoYAnomaly detected: Oct drop (-44%)
Correlated with pricing page change on Oct 3
Insight: Recovery after reverting pricing - recommend A/B testing new tiers
Schedule reports for weekly updates, monthly reviews, or quarterly analyses. Formatted reports with charts, narratives, and insights - delivered to the right people.
Book a consultationWeekly Report
$284k
↑ 18%
Revenue
1,247
↑ 12%
New Users
2.1%
↑ 0.3%
Churn
Executive Summary
Revenue grew 18% driven by enterprise deals. Churn ticked up slightly - recommend proactive outreach to at-risk accounts in fintech segment.
Your team can query data through chat without SQL or analyst support. Ask a question, get an instant answer with supporting visualizations.
Book a consultationData assistant
What's our churn rate by segment this quarter?
Here's your Q4 churn by segment:
💡 SMB churn up 1.2% from last quarter - linked to pricing change
From data sources to stakeholder-ready insights - here's how your AI reporting agent operates.
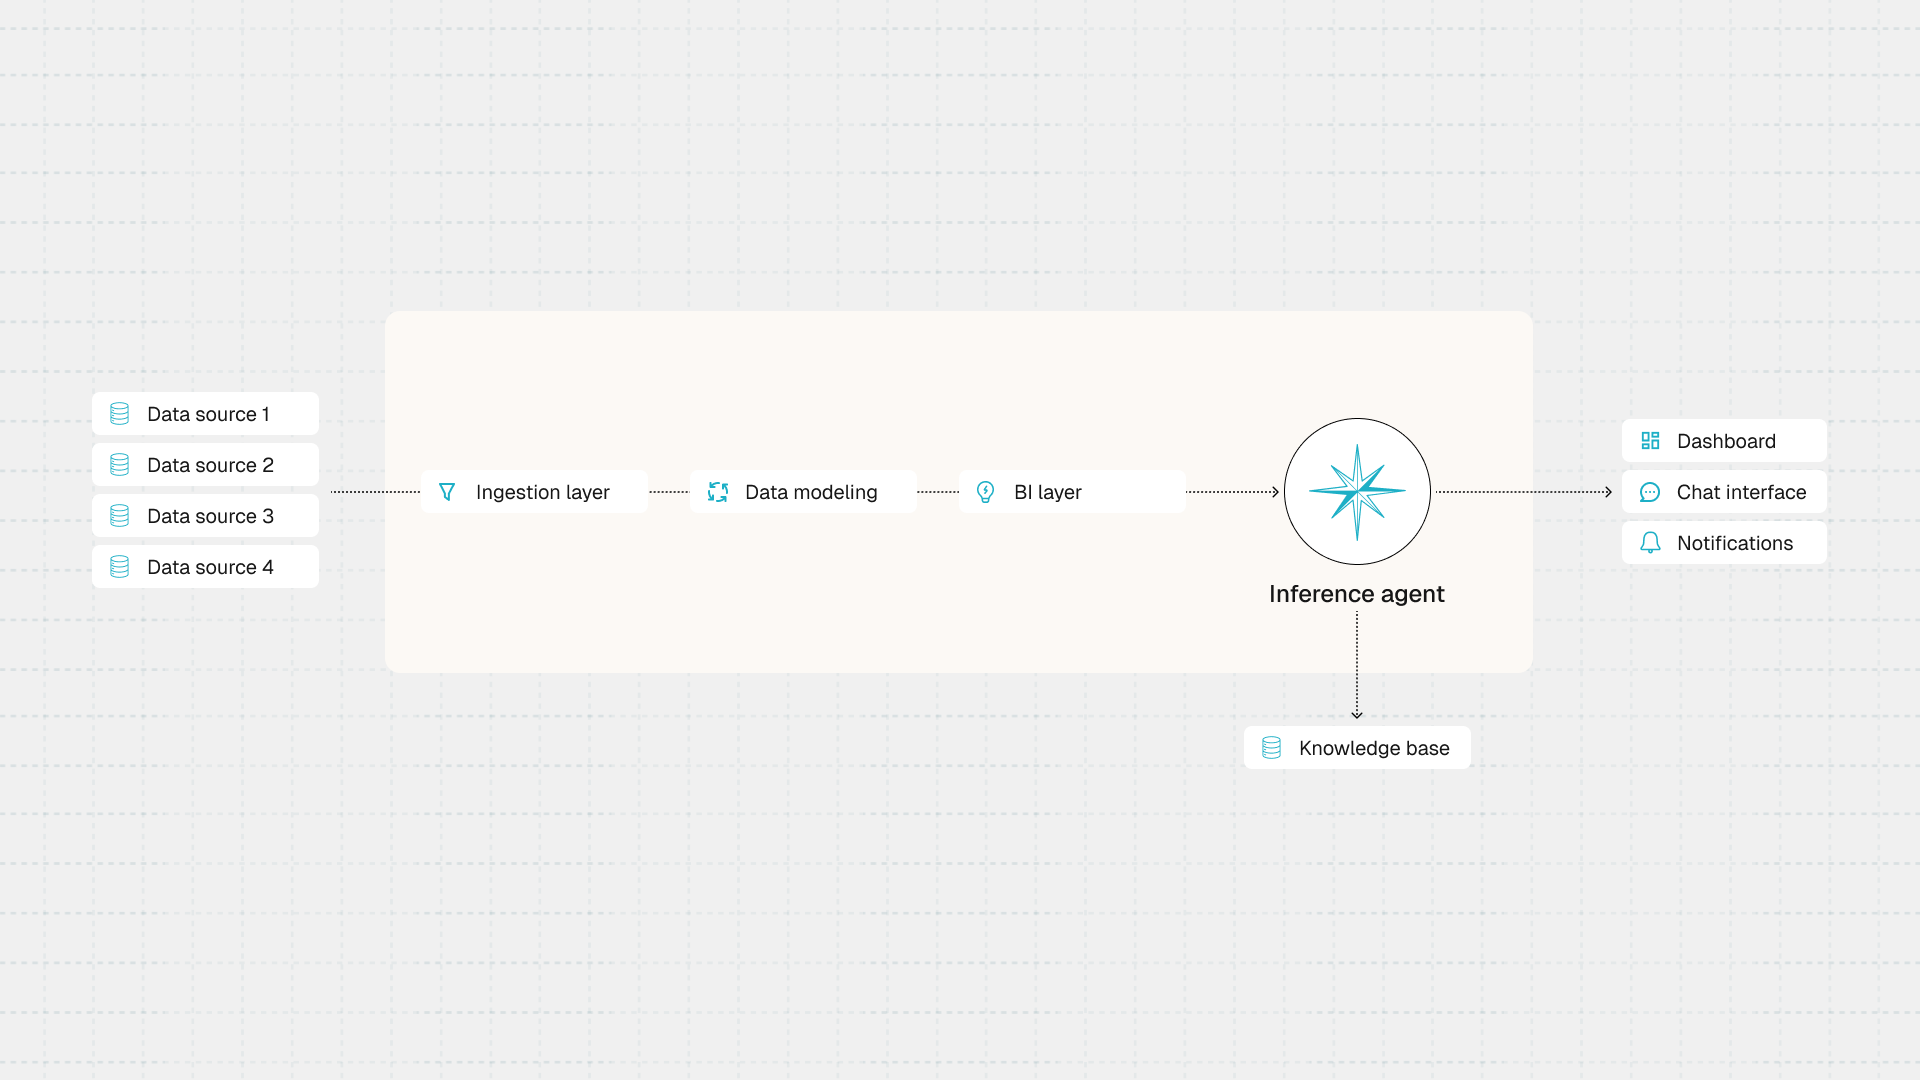
Four specialized agents working together to transform your data into decisions.
Connects to multiple data sources, handles authentication, pulls fresh data on schedule, and manages data quality checks.
e.g. Syncs Salesforce, HubSpot, and Google Sheets data nightly, resolving duplicates and format differences.
Cleans, transforms, and structures data into a unified model that supports both reporting and ad-hoc analysis.
e.g. Normalizes revenue data from 3 different billing systems into a single consistent format for analysis.
Analyzes data to identify trends, anomalies, and patterns, then generates insights and narratives that explain what's happening and why.
e.g. Discovers that companies in the fintech vertical close 40% faster and recommends adjusting targeting.
Generates dashboards, sends scheduled reports, handles conversational queries, and delivers notifications when metrics hit defined thresholds.
e.g. Sends a Slack alert when daily sign-ups drop below the 7-day average by more than 20%.
Built for teams who need insights, not just dashboards.
Connects to databases, CRMs, analytics platforms, and spreadsheets to pull data from wherever it lives.
e.g. Pulls Salesforce pipeline data, Google Analytics traffic, and Stripe revenue into one weekly executive report.
Identifies trends, anomalies, and patterns in your data, then surfaces insights that matter to your business.
e.g. Spots that customer churn spikes 60 days after onboarding and recommends a proactive check-in workflow.
Creates formatted reports, dashboards, and summaries on schedule or on-demand with context-aware narratives.
e.g. Generates a Monday morning summary with key metrics, wins, risks, and recommended actions for leadership.
Chat interface lets stakeholders ask questions and get instant answers backed by real data - no SQL required.
e.g. "What's our churn rate by segment this quarter?" gets an instant, accurate answer with supporting chart.
Traditional BI
Your AI Reporting Agent
Dashboards you have to interpret yourself
Analyzes data and tells you what matters, not just what changed
Scheduled reports with no flexibility
Handles ad-hoc questions conversationally without analyst support
Charts and graphs without context
Generates narrative insights that explain the story behind the numbers
Static automation with fixed rules
Learns what matters to your business and proactively surfaces patterns
Common questions about AI Reporting & Insight Generation.
Can't find what you're looking for? Email sachi@thinklylabs.com.
Book a demo to see how AI-powered reporting can transform your decision-making.